Runs directly on this page
The WebGL 2 mushroom scene, controls, metrics, and report all stay on this page—no redirect, iframe, download, or third-party benchmark site.
Local WebGL 2 · No download · Score on Start
Run the colorful Volume Shader scene here. A real frame can preload and hold still; hover for full-quality slow spin, drag for fast control, then Start when you want a timed score.
Preview and scoring both use this page’s local WebGL 2 renderer. Start begins the timed score; Stop ends the scored run and opens a downloadable session report.See fair comparison setups
Key features
The renderer, controls, live measurements, and report all run in this page. There is no third-party frame or redirect—preview, Start scoring, and Stop stay under your control on this site.
The WebGL 2 mushroom scene, controls, metrics, and report all stay on this page—no redirect, iframe, download, or third-party benchmark site.
Hover for a full-quality preview with a slow spin. Drag to turn faster, and scroll or pinch to zoom—same renderer as the timed test.
Run the same local renderer on a phone, tablet, laptop, or desktop whose browser supports WebGL 2.
A still real frame may preload after open. Continuous scoring starts only with Start. Stop ends the timed run and keeps results local.
What it is
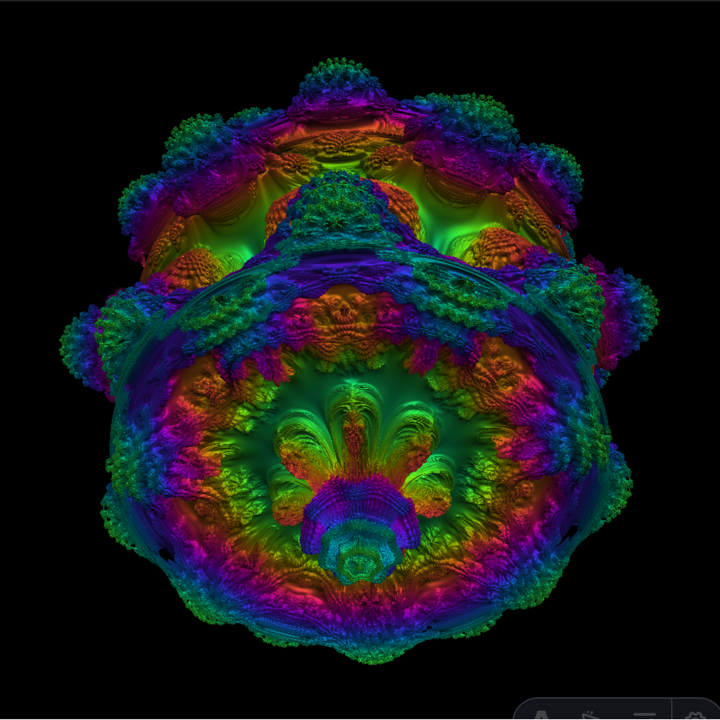
Volume Shader BM is a popular name for browser GPU tests that use fragment-shader math and repeated ray-marching work to draw a continuously changing volumetric scene. “BM” means benchmark. This implementation renders a colorful mushroom-like field and measures its own frame loop directly.
Browser GPU tests may use different shaders, resolutions, timers, and scoring rules. This page measures its own renderer directly, so its FPS and score describe this workload only and are never presented as another benchmark’s result.
This benchmark needs JavaScript, canvas, and a working WebGL 2 context. It can run on current phone and PC browsers, but managed devices, disabled hardware acceleration, older drivers, or strict browser settings can produce a blank scene or compilation failure. Support does not guarantee fast rendering.
Visit the GPU test tools hub for related checks, or open theWebGL capability checker before loading the full scene. The checker confirms API availability only; it does not predict the full benchmark’s FPS.
| Tool type | Install | Main signal | Best use |
|---|---|---|---|
| This browser benchmark | None | Live FPS and local score | Quick same-tool comparisons |
| Other web benchmark | None | Site-specific FPS or score | Comparisons inside that implementation |
| Native GPU suite | Required | Multiple standardized workloads | Detailed hardware comparison |
How to
Preview the real scene, interact at full quality, then Start for a timed score. Stop ends the scored run, freezes the continuous load again, and opens the local session report.
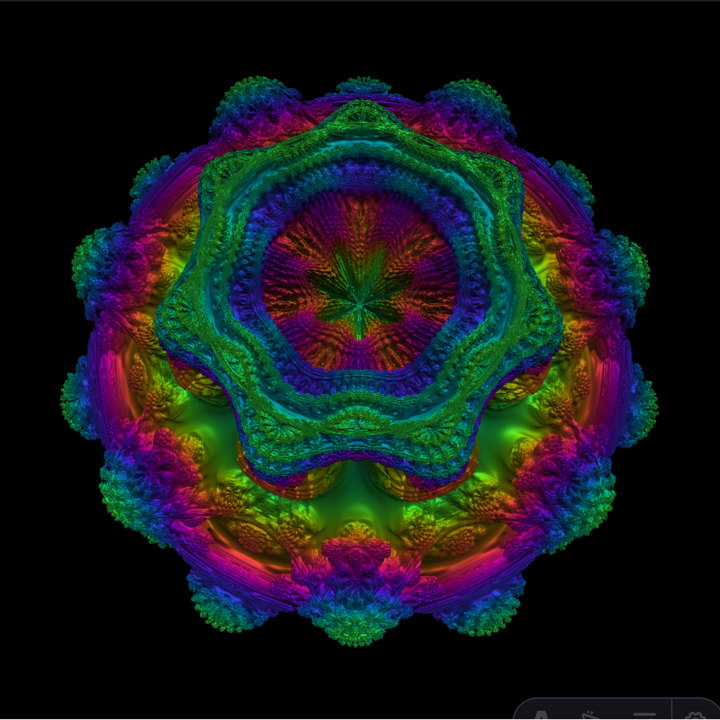
After the page opens, a real WebGL mushroom frame can preload and hold still so you are not looking at a fake photo.
Hover for full-quality slow spin, drag for fast control, and scroll or pinch to zoom. Matching view and browser conditions still matters for fair comparisons.
Press Start for the timed scored run (faster auto-spin). Press Stop for average, min, and max FPS, duration, score, and device details in a local report.
Why choose this test
FPS, frame time, and duration come from the same loop that draws the scene on this page.
Stop cancels the animation frame, deletes the program, and requests WebGL context loss.
Idle holds a still frame; hover/drag is full-quality preview; Start is the scored run. Stop when the device becomes warm or slow.
Reports are generated locally and can be copied or downloaded without submitting benchmark data.
Pro tips
This page gives you a continuous interactive workload, not a hardware certification. Decide what you will observe before starting, prepare both devices the same way, and record every browser or power condition that could change the experience.
Open this page on both devices. Do not compare its score with another site that uses a different shader or resolution rule.
Keep orientation, browser viewport, zoom, rotation, and camera distance aligned because visible work changes with the view.
Let warm hardware cool, then test both plugged in or both on battery with the same power-saving policy.
Record the browser and version. Shader compilation, graphics backends, and scheduling can differ across browsers.
Avoid leaving the volume shader test running in the background. Stop it, let the device recover, and repeat the same procedure.
Recommended setups
The current version has one balanced workload rather than Light, Standard, Heavy, or Extreme modes. Choose a testing procedure based on the device and question, and stop as soon as the observation is complete.
Use a cool phone, close demanding apps, keep one orientation, and observe briefly. Stop at the first sign of heat or lost input.
Open launcherCompare AC and battery only as separate runs. Keep browser, viewport, camera, thermal starting point, and background activity fixed.
Open launcherUse the same browser version and window size, reproduce the same view, and describe how smoothness was observed or measured externally.
Open launcherSave the default shader first. Any CONFIG edit creates a custom experiment and must not be reported as a default VSBM comparison.
Open launcherFAQ
Direct answers about the local renderer, phones, FPS scoring, code provenance, safety, and fair comparisons.
A volume shader test is a browser graphics workload built around fragment-shader calculations and a continuously rendered volumetric-looking scene. This tool uses ray marching to create sustained GPU work, but it is not a hardware certification or complete benchmark suite.
BM means benchmark. Volume Shader BM, volumeshader_bm, and VSBM are common search terms for this type of browser GPU test. Different sites may use different shaders, resolutions, counters, and scoring rules, so compare results only within the same tool.
No. The canvas, WebGL 2 shader, controls, live measurements, and report run directly on this page. It does not embed or redirect to another benchmark website.
Yes, if the mobile browser supports WebGL 2. Close heavy apps first, avoid testing while the phone is already hot, and be ready to stop if touch input becomes unresponsive. Results vary with browser engine, temperature, battery mode, and viewport.
FPS is counted directly from frames completed by this page’s rendering loop. The local score is average FPS multiplied by 100. It is useful for repeated runs in this tool, but it is not comparable to scores from a different benchmark.
There is no universal good score because viewport, browser, power mode, temperature, and refresh rate affect the result. Compare two devices with the same browser, viewport, camera view, power state, and starting temperature.
A slow or frozen volume shader test usually means the workload is too heavy for the current browser, the device is throttling, or hardware acceleration/WebGL is unavailable. A black frame can also follow shader compilation failure. Stop the frame, cool the device, close GPU-heavy tabs, then check the WebGL capability tool.
A short browser test should not damage healthy hardware, but the continuous shader can raise power use, temperature, fan speed, and input lag. Device protection may throttle or terminate the work. Stop immediately if the device becomes unusually hot, unstable, or difficult to control.
No benchmark report is submitted to a result collector, account, or leaderboard. PageView traffic analytics and Microsoft Clarity interaction analytics operate separately as described in the Privacy Policy.
Publicly viewable source is not automatically open source. The related public repositories do not declare a license that grants commercial copying rights, and the competitor’s terms prohibit reverse engineering. This renderer is therefore independently implemented.
Browsers can use different WebGL implementations, shader compilers, graphics backends, frame scheduling, and power policies. A browser change can alter the experience even on the same GPU, so cross-browser runs measure the browser stack as well as the hardware.
Use this same page, browser version, viewport size, camera position, zoom, power state, and starting temperature. Close background GPU work, use the same run duration, and compare the average FPS or score in the final report.
Ready to test
Preview first if you want, then press Start only when you are ready for a timed scored run. Keep the run brief, and use Stop to end scoring and free continuous GPU work.
Back to the test launcher